By Science Writer
5/14/25
If you zoom out on the climate timeline of the last thousand years, it looks relatively steady—until suddenly, in the late 1800s, everything spikes.
That moment in history? It’s not random. It’s the rise of industry: factories, coal, steam engines, and later, cars and oil. And that’s where the climate story changes.
Industrialization and the Climate Connection
Before industrialization, carbon dioxide (CO₂) levels stayed around 280 parts per million (ppm) for thousands of years. But after humans started burning coal and oil at scale, CO₂ shot upward.
By 2024, atmospheric CO₂ has passed 420 ppm—an increase of over 50% in just a few centuries.
During that same period, global surface temperatures began to rise. What we’re seeing isn’t just a coincidence. It’s a tightly connected chain reaction backed by physics and confirmed by direct observation.
Sources:
– Lüthi et al., 2008 – Nature
– NOAA Global Monitoring Lab – https://gml.noaa.gov/ccgg/trends/
Why Carbon Dioxide Matters
Carbon dioxide is a greenhouse gas. It traps heat in Earth’s atmosphere. This is not a theory—it’s basic thermodynamics. Without CO₂, Earth would be frozen. But with too much of it, things heat up fast.
When we burn fossil fuels, we release carbon that was stored underground for millions of years. The chemical fingerprint of this carbon tells us exactly where it came from. And the levels in our atmosphere today directly match industrial activity—not natural cycles.
Key Point: The more fossil fuels we burn, the more CO₂ we add, and the more heat gets trapped.
Can Natural Causes Explain This?
Many people wonder whether volcanoes, solar activity, or ocean cycles could be responsible for today’s warming. Scientists have tested all of those ideas.
Climate models that only include natural forces cannot explain the rise in temperature over the last 150 years. When we include human-generated emissions, the models match what we see in the real world.
Sources:
– IPCC Sixth Assessment Report (AR6), 2021 – https://www.ipcc.ch/report/ar6/wg1/
– Hegerl et al., 2007 – Nature
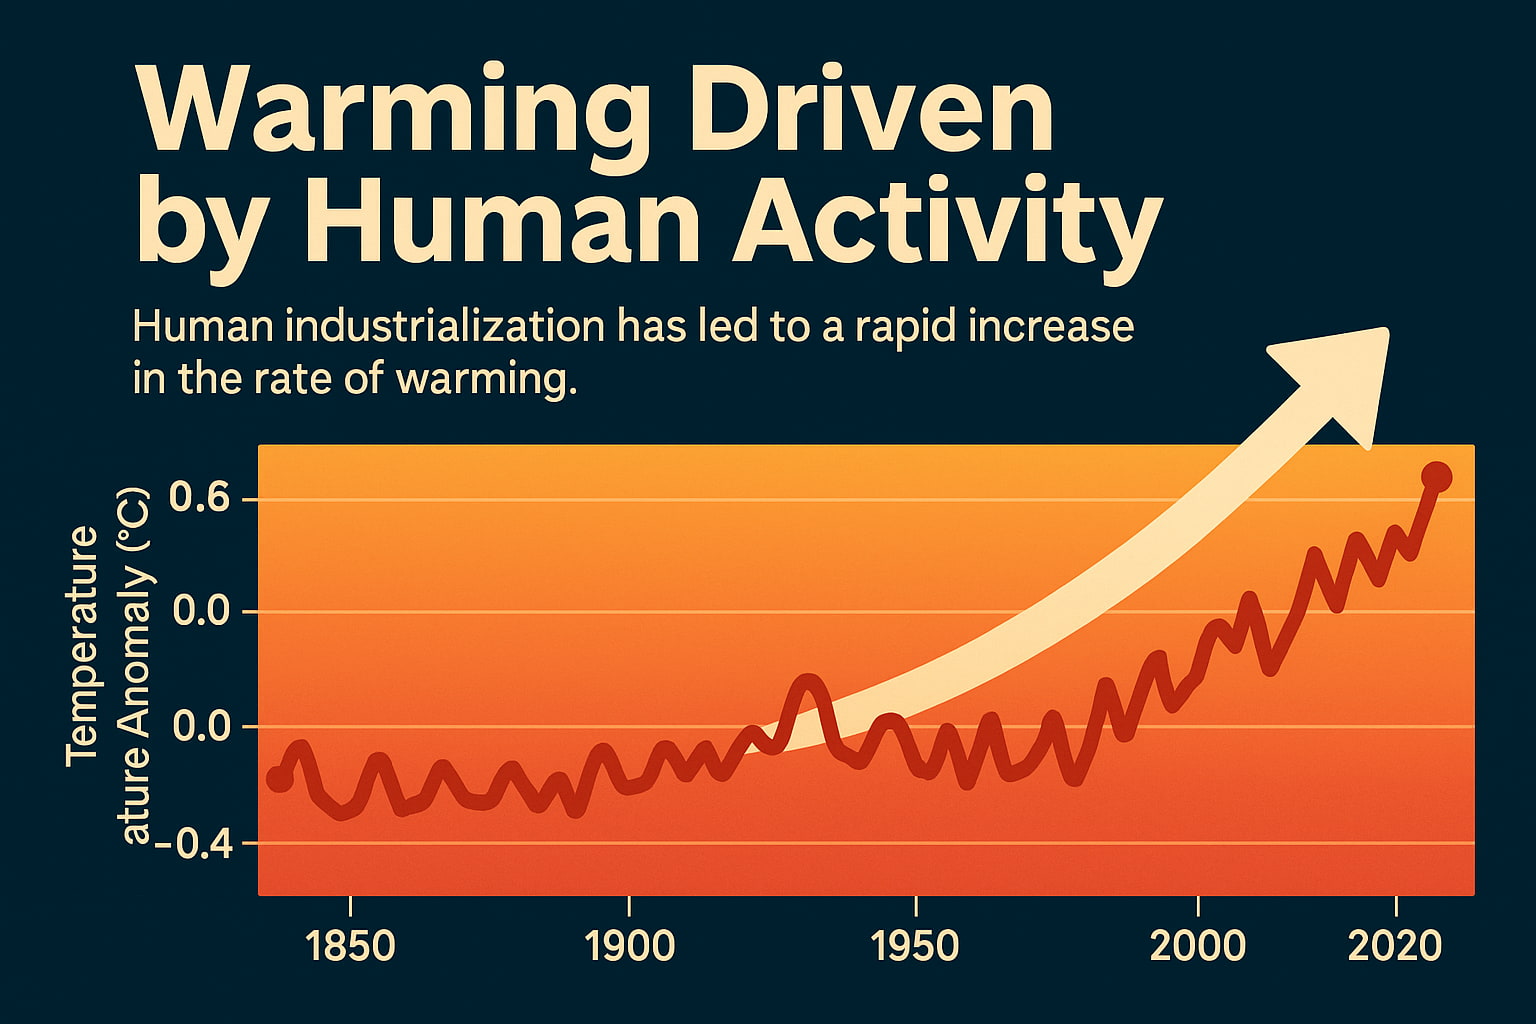
Visual Evidence: CO₂ and Temperature
The chart below shows the correlation between atmospheric CO₂ and global temperature anomaly over the past 1000 years. The sudden rise in both began during the industrial era. This trend is no longer in question—it’s documented across thousands of scientific papers and datasets.
Want to go deeper? The Keeling Curve from Scripps Institution of Oceanography offers a clear, real-time record of this data:
https://scrippsco2.ucsd.edu
The Bottom Line
Industrialization didn’t just change how we live. It changed the atmosphere. The connection between fossil fuel use and global warming isn’t just likely—it’s clear, measurable, and undeniable.
We’re not passengers in this crisis. We’re behind the wheel. And that means we have the power—and the responsibility—to change direction.